BING-JHEN HONG
NVIDIA (NVDA) plunged 10% last Friday for its worst session since March 2020. The move came on no major news but concerning earnings reports and outlooks from overseas semiconductor companies such as Taiwan Semiconductor (TSM) and ASML Holding (ASML) tempered the once-hot industry. Chip stocks command about a 10% weight in the S&P 500 as the AI boom presses on. The rally does not come without its periodic stumbling blocks, of course, and the last few weeks illustrate that it’s never an elevator ride up for investors.
I have a hold rating on the YieldMax NVDA Option Income Strategy ETF (NYSEARCA:NVDY). I see the covered call fund as more attractive today given much higher option premium, but I see technical concerns with NVDA’s share price. I will detail where I think the ETF would be a buy.
1-Month S&P Performance Heat Map: NVDA Down 16%, Among the Biggest Laggards
Finviz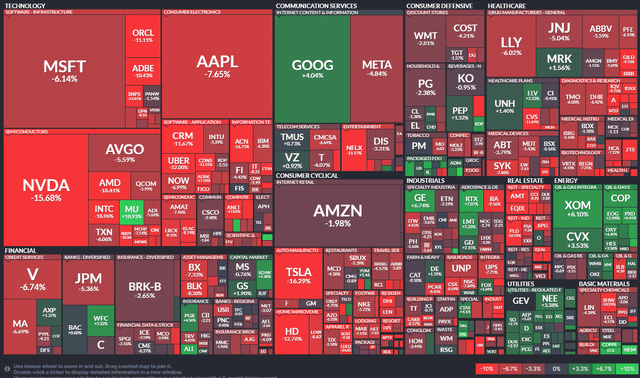
According to Bank of America Global Research, NVIDIA designs and sells graphics and video processing chips for desktop and notebook gaming PCs, workstations, game consoles, and accelerated computing servers and supercomputers.
NVDY, on the other hand, is an actively managed exchange-traded fund, or ETF, which seeks to generate monthly income by writing call options on NVDA. NVDY pursues a strategy that aims to harvest compelling yields while retaining capped participation in the price gains of NVDY.
The current distribution rate is 135% as of April 19, 2024, and the portfolio pays distributions monthly. You can view the distribution schedule here. Seeking Alpha notes that the trailing 12-month dividend yield is 53.2%, of course the vast majority of that yield comes from selling options, so it is not like a traditional ETF dividend.
NVDY is a small ETF with just $375 million in assets under management, and it has a high 1.01% annual expense ratio. Share-price momentum has been lately, given the steep retreat in NVDA. It is also a risky ETFbut has strong liquidity given average daily volume of close to 600,000 shares over the past 90 days, though NVDY’s median 30-day bid/ask spread is somewhat wide at 0.17% on average.
NVDL: Portfolio Holdings
YieldMax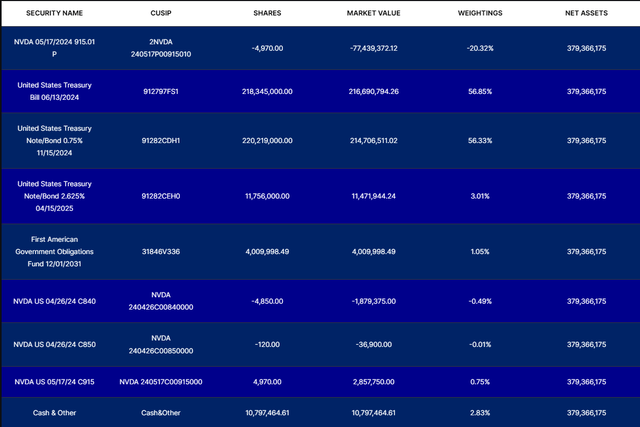
What makes NVDY interesting today is that NVDA’s implied volatility has surged to above 53%, according to data from Option Research & Technology Services (ORATS). We typically only see that right before an earnings announcement, so investors could be in store for a protracted period of high volatility.
That presents an opportunity for a fund like NVDY since it sells call options to generate income. More expensive option premium means more income collected, all else equal.
NVDA Implied Volatility Rises, Making Call-Selling More Attractive
Fidelity Investments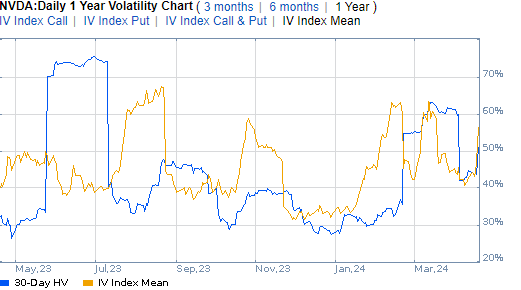
The offset is that lofty volatility has coincided with a steep drop in NVDA’s stock price. Shares are close to technical bear market territory, down almost 20% from their all-time closing high from earlier this year.
NVDA: Shares Down 20% From Their All-Time High, Worst Drawdown Since 2021-2022
Koyfin Charts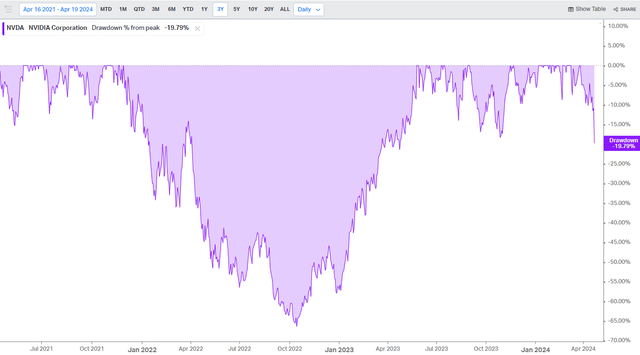
With NVDA selling for 25 times FY 2026 earnings, I noticed that May has historically been the chip stock’s best month when analyzing seasonal trends over the past 10 years. The average gain is more than 12% with a median return of 10%. So, given the company’s valuation today and the stock’s bullish trend once April finishes, giving NVDA and NVDY a close look is warranted.
NVDA: Bullish May Historical Trends
Seeking Alpha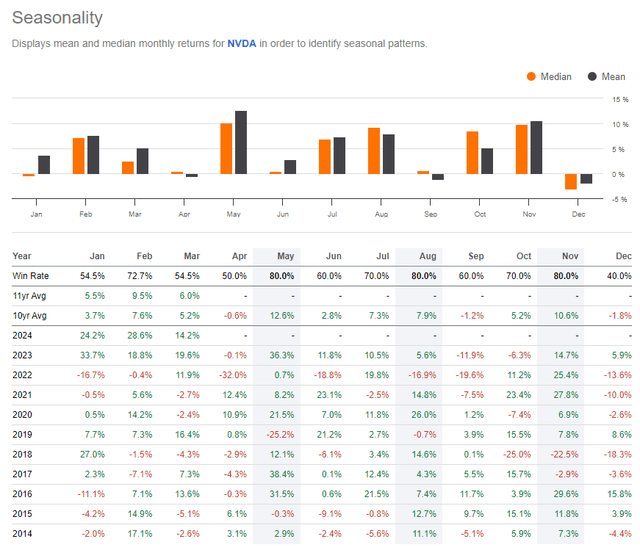
Looking ahead for future volatility catalysts on NVDA shares, the company is slated to present at the RSA Conference 2024 in San Francisco from May 6 to 9. Then comes the firm’s Q1 2025 earnings date which is confirmed to take place on Wednesday, May 22 AMC.
NVDA: Corporate Event Risk Calendar
Wall Street Horizon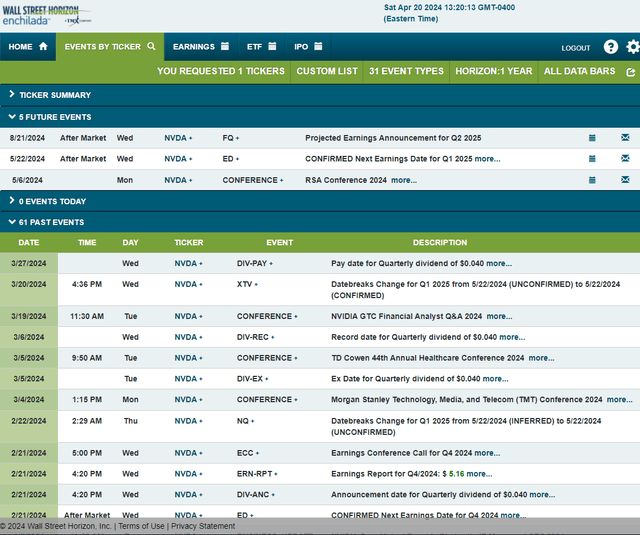
The options market has priced in a 10.3% earnings-related stock price swing when analyzing the at-the-money straddle expiring soonest after the reporting date. That is the most expensive straddle in at least the last three years, according to ORATS data, indicating that selling options today is more lucrative than before previous earnings events.
NVDA: Implied Volatility Surges Well in Advance of May Earnings
PRAYERS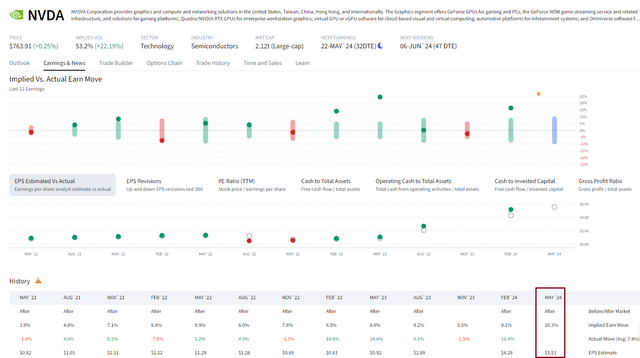
The Technical Take
With NVDA priced attractively on earnings considering its growth rate and as implied volatility runs historically high, we must gauge NVDA’s chart to get a sense of when and where to potentially purchase NVDY. Notice in the graph below that NVDA has a lingering gap down at the $675 level. That is also where the 50% retracement of the October 2023 to March 2024 rally comes into play. Above that, I noticed that the 38.2% Fibonacci retracement point is $749 – not far from where NVDA settled last week. The question is: Is a low in place?
I don’t think so, at least not quite yet. Following a bearish RSI momentum divergence last month and the loss of key support in the $830 to $840 zone, a further corrective move is likely in my view. That assertion is backed up by a high-volume selling event on Friday, April 19. We need to see signs that downside momentum is subsiding before going outright long. For NVDY, I like the fact that volatility has kicked up, but gains can be quickly wiped out if NVDA trends down. Buying NVDA or NVDY when the former reaches into the $600s appears as a more prudent approach.
Overall, I expect more downside with NVDA, which would be bearish for NVDY. But shares are not too far from critical support, and that level could be reached in advance of NVIDIA’s late May Q1 reporting date.
NVDA: Eyeing Downside Targets, $675 Gap In Play
StockCharts.com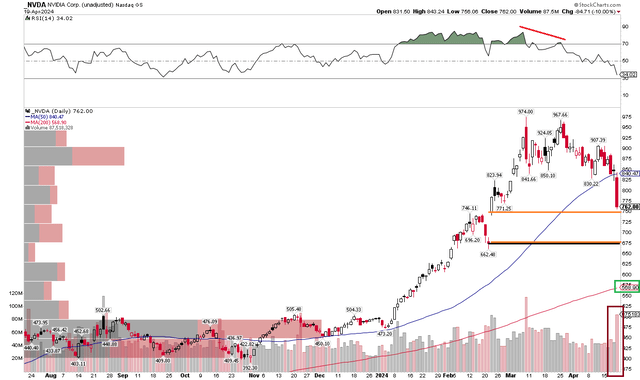
The Bottom Line
I have a hold rating on NVDY. The quick rise in implied volatility should put this option-selling ETF on investors’ radar screens. But with downside risks to NVDA, the time is not quite right, in my opinion, to get long NVDY. Waiting until implied volatility rises and NVDA shares reach into the $600s is a better risk-reward idea.


