Luis Alvarez
ETF Overview
iShares U.S. Utilities ETF (NYSEARCA: GOING) has a portfolio of large-cap and mid-cap utility stocks in the United States. Its expense ratio of 0.4% was high among its peers. For example, Fidelity MSCI Utilities ETF (FUTY) only has an expense ratio of 0.08%. While IDU has lower volatility, the fund will likely deliver a total return inferior to the broader market in the long run due to its slower growth characteristic. Its valuation is also not cheap right now. Hence, we are unable to recommend this fund right now.
YCharts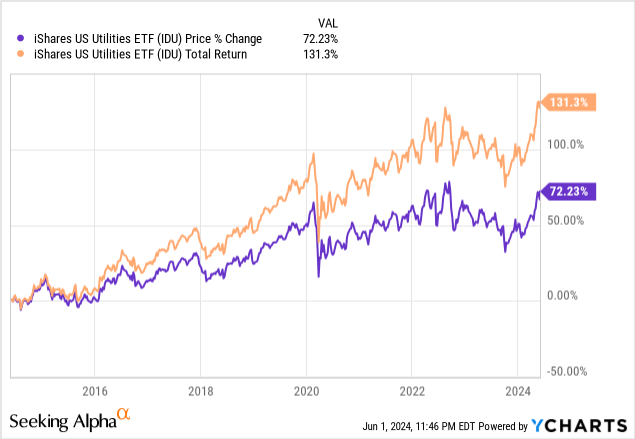
Fund Analysis
IDU has outperformed the broader market year-to-date
Let us first review IDU’s performance in the past two years. IDU has done quite well this year. The fund has delivered a total return of 16.4%. This was better than the S&P 500 index’s 11.3%.
YCharts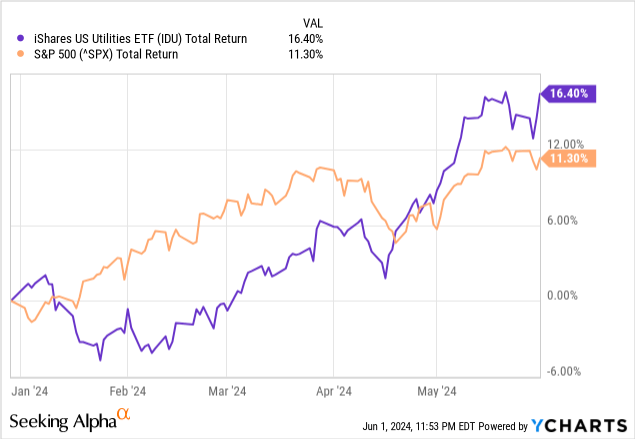
However, since the broader market reached the cyclical low in October 2022, the fund’s performance was not that outstanding. Since October 2022, IDU only delivered a total return of 25.1%. In contrast, the S&P 500 index delivered a total return of 51.2%, more than double the total return of IDU.
YCharts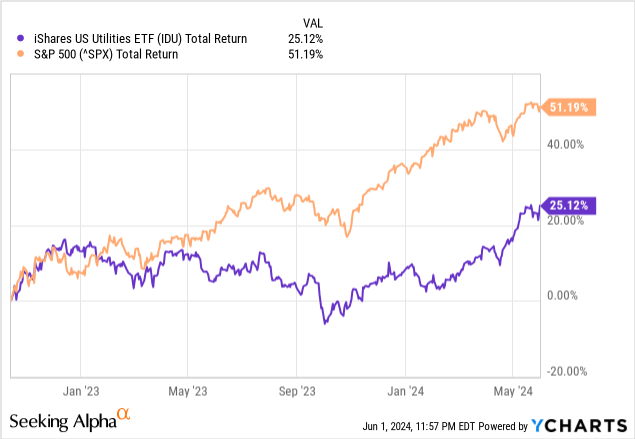
IDU has lower volatility than the broader market
IDU has lower volatility than the broader market. This is evident in the fact that its 5-year average beta ratio is only 0.74 relative to the S&P 500 index. For reader’s information, beta is a measure of the volatility of the fund. A higher beta (more than 1) indicates that when the index moves up or down, the fund will move more than the broader market. In contrast, a lower beta (less than 1) indicates that the fund will move less than the broader market. Since IDU’s beta ratio was below 1, we expect IDU to have less downside risk than the broader market.
However, IDU will likely underperform the broader market in the long run
Despite IDU’s lower volatility, its total return has trailed the S&P 500 index in the past. As can be seen from the chart below, IDU’s total return of 131.3% in the past 10 years was significantly behind the S&P 500 index’s 230.3%.
YCharts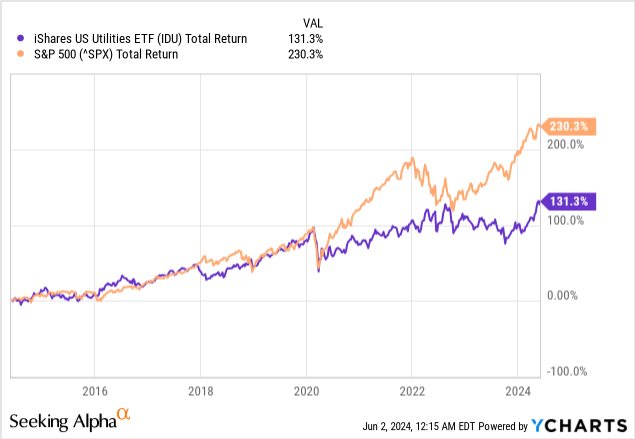
What has caused IDU’s lower returns in the long run? The answer is quite simple. Utilities sector is not a rapidly growing sector. Take utilities sector in the S&P 500 index as an example. As can be seen from the chart below, the annual revenue growth forecasts for utilities stocks in the S&P 500 index for 2024 and 2025 are only 3.2% and 4.5% respectively. This is much lower than many other growing sectors, such as the technology sector, that typically has an average revenue growth rate in the low to high double-digits.
Yardeni Research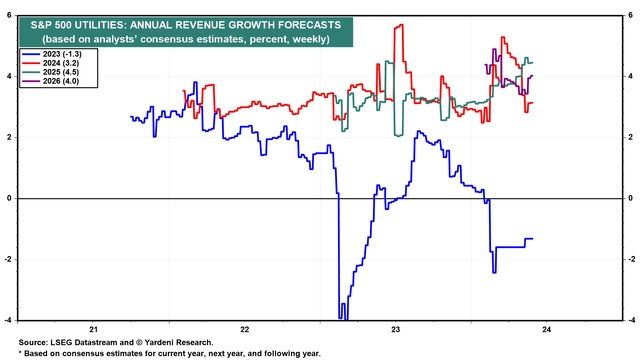
IDU’s fund price is sensitive to treasury rate
Since utilities stocks are typically considered as dividend paying stocks. Investors owning these stocks typically will consider their dividend yields. Therefore, valuations of utilities stocks are typically impacted by the treasury rate. As the treasury rate rises, stock prices will typically decline and vice versa. This is exactly what we observed in IDU’s fund price. As can be seen from the chart below, IDU’s fund price typically has an inverse correlation to the 10-year treasury rate. In the long run, IDU’s fund price may still move up, but its fund price can be quite sensitive to the change in treasury rate in the short term.
YCharts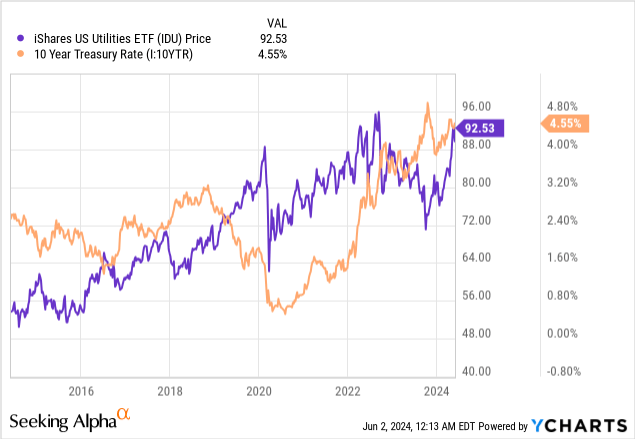
Top Holdings
IDU’s top holdings include many well-known utilities companies. For example, its largest holding, NextEra Energy (NEE), is a stable power generation and distribution company servicing areas mainly in Florida. NEE’s top and bottom lines have been steadily increasing in the past few years. Its second-largest holding, Southern (SO), has 9 million customers across 3 states. Its businesses are primarily in electricity generation and distribution, and gas distribution. SO’s bottom line has also been growing steadily in the past 3 years. Overall, most of these companies are expected to grow their businesses steadily.
iShares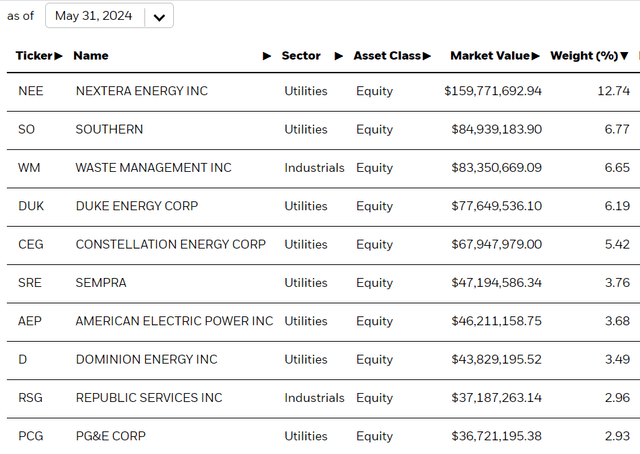
Fair Valuation
Now that we learned about IDU’s characteristic, we will evaluate its valuation. Since we do not have the historical average of IDU’s forward P/E ratio in the past, we will look at the forward P/E ratio of utilities stocks in the S&P 500 index. As can be seen from the chart below, utilities sector in the S&P 500 currently has an average forward P/E ratio of 16.9x. Historically, the forward P/E ratio has been in the range between 10x and 20x. The average is around 15x. Therefore, the current forward P/E ratio of 16.9x is higher than the long-term average in the past 3 decades. This means it is not cheap right now. However, it is also not near the record of about 22x reached in 2022. Therefore, we do not think IDU is very expensive either.
Yardeni Research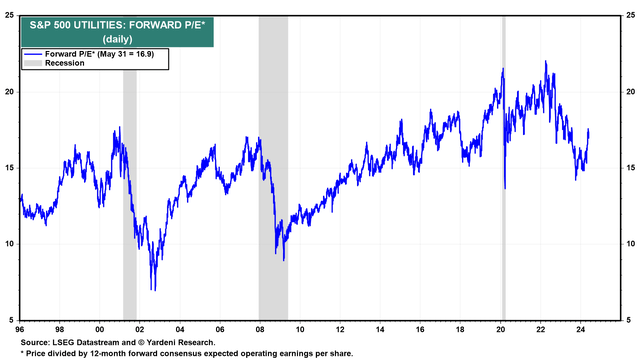
Investor Takeaway
If the goal of owning IDU is to seek total return in the long run, IDU is not the fund to own, as its total return will likely trail the S&P 500 index. For those wishing to own IDU regardless of its growth characteristics, its valuation is not at a discount either. Therefore, we cannot recommend this fund right now. We think investors may want to wait on the sidelines or wait for a pullback.


