marinzolich/iStock via Getty Images
AGNC Investment Corp. (NASDAQ:AGNC) reported its 2nd quarter results, announcing expected numbers amidst the bouncing and noisy financial markets. In the report, the company noted that NAV, net asset value, dropped once again from the almost predictable noise experienced during the quarter, falling from $8.85 to $8.40. Obviously, the bond markets haven’t been stable in the last three years, experiencing more extreme noise from inflation signaling high rates than followed by weakness signaling lower rates. In the past several quarters, with this type of announcement, the stock price would also have plummeted. It didn’t. This continues our coverage of AGNC, the last being, AGNC’s Q1 Earnings Model Suggests A Safe Dividend Going Forward. Asking of why seems obvious, yet more detail is in order. The market is predicting future positives, supporting the price even with uncertainty. Shall we go find more?
The Marketplace Revisited
In our article, Defending AGNC’s Dividend, we included a short watch list of parameters management considers significant in determining performance. In this article, we revisit the list, including updated numbers.
Yield curve. Agency MBS spreads. Bloomberg Long Treasury Bond Index. Highly rated corporate debt.
We begin with the US Treasury Curve graph. The first is the most current.
US Treasury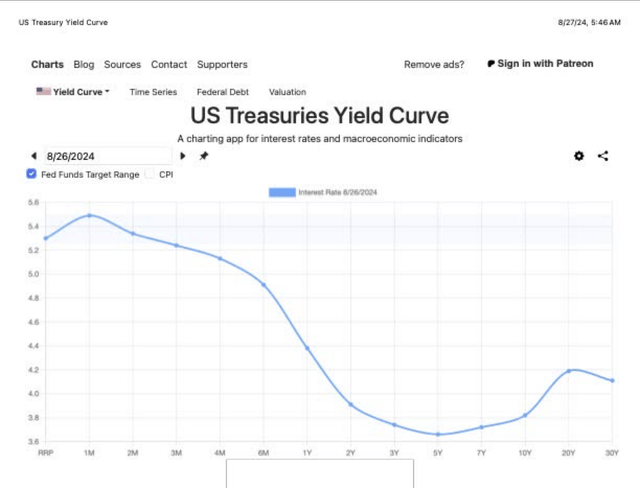
The second is the curve created in December.
US Treasury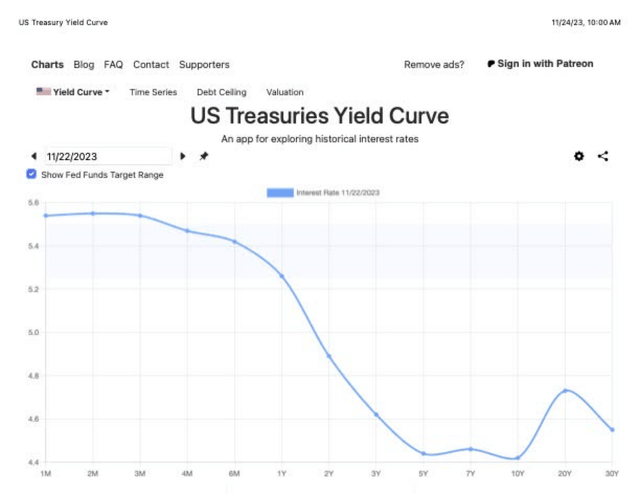
In comparison, the middle of the curve increased, but the general shape remains the same.
For comparison, an example of the curve profile shortly before the interest rate hikes began follows.
US Treasury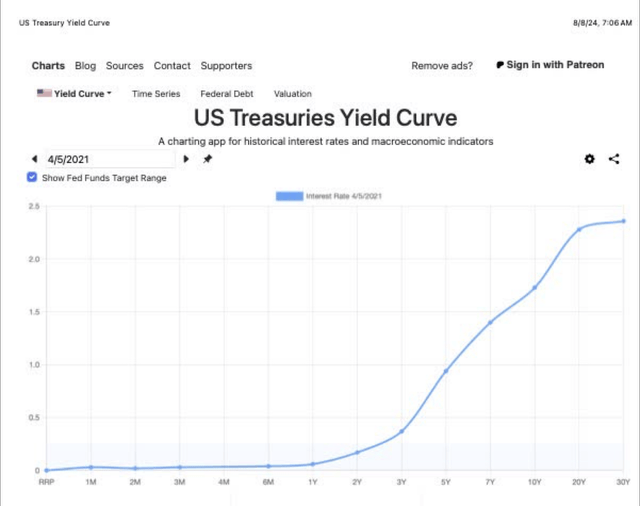
It is clear that rate cuts effects haven’t yet appeared, but changes are coming.
Next is a graph of Agency MBS.
FRED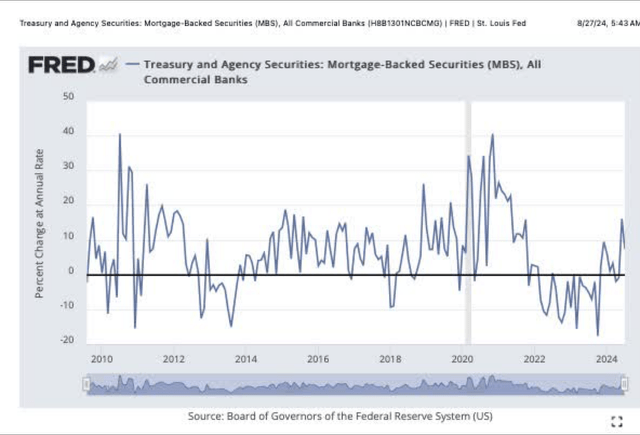
Notice the bullish positive separation appearing. Most of the change occurred after the June quarter. We ask, will this bullish stance turn the dollar roll earnings around? In time, we shall know.
From our article, “For those who have access to Bloomberg’s Long Treasury Bond Index, this link opens a graph.” The symbol is LUTLTRUU:IND. The current value equals 3,408.”
Finally, a graph from Schwab of Investment Grade Corp. Bonds follows.
Schwab 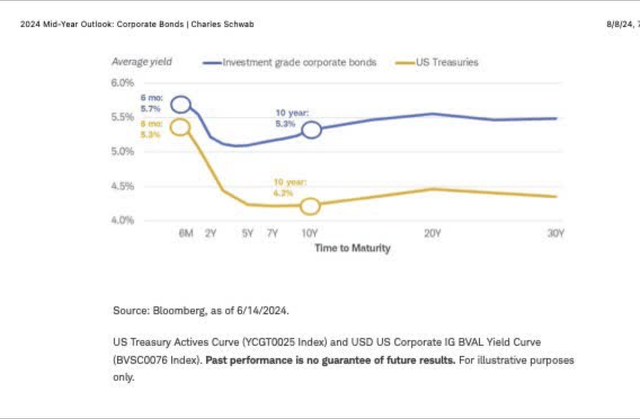
For comparing this to our former chart, we include the graph from Schwab of Investment Grade Corp. Bonds posted prior.
Schwab 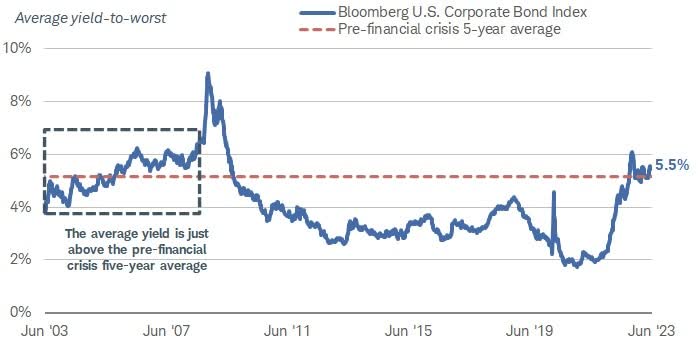
The yields remain in the 5.5% range unchanged. The revisited marketplace shows investors that critical performance determining parameters are now in the very early stage of repair, in particular the real positive improvement in the MBS value. The treasure curve remains relatively unchanged.
The Future
Now, a look forward into the future of interest rates is more than in order. From Reuters,
“The August 2024 SOFR futures have factored in the likelihood that the Fed will cut interest rates by at least 25 basis points (BPS) this month. The September futures, on the other hand, have priced in a 100% chance of at least a 50-bps rate reduction.
A weak jobs report and other indicators, manufacturing index, (ISM) turned negative in June, printing a 46 in July.
The recent comments of Fed Chairman, Jerome Powell at Jackson Hole, By confirmed the change in posture; lower rates are coming.
The Results
The results for the quarter including a several quarter summaries are shown in the next few slides, first the quarter.
AGNC 2nd Quarter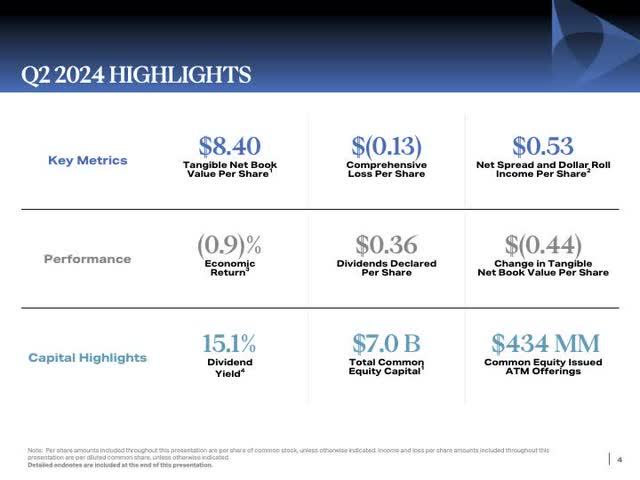
Next, the history slide follows.
AGNC 2nd Quarter
Notice the continued downward drift in the Net Spread and TBA Dollar Roll. We were expecting this drop for a period with the weak Agency MBS vs. Treasuries chart included above. That chart started to perk up in the last several weeks in anticipation of a September rate cut. Management noted,
“Net spread and dollar roll income for the quarter remained well above our dividend at $0.53 per share. The $0.05 per share decline for the quarter was due to a decrease in our net interest rate spread of approximately 30 basis points to just under 270 basis points for the quarter, as higher swap costs more than offset the increase in the average yield on our asset portfolio.”
The next slide illustrates for investors some key parameter trends for the last several quarters.
AGNC 2nd Quarter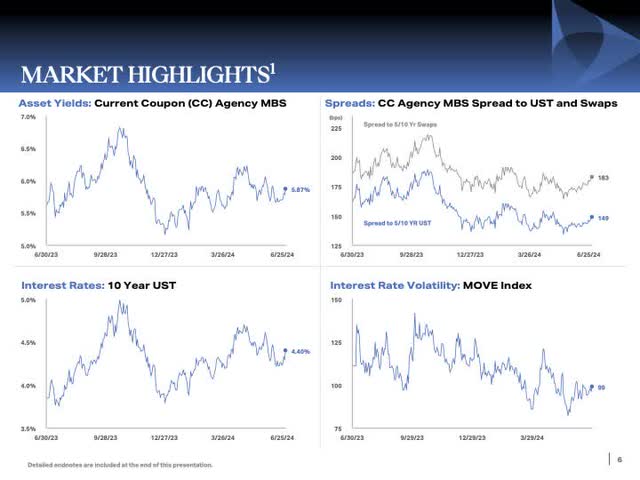
In the lower right, the company included a chart of the MOVE Index, the VIX for bonds. Of importance to AGNC, this index is slowly trending lower, a direction which is highly important to the performance of the company. Volatile bond movements grant management migraines in attempting to manage the business.
Management also sold more stock. Of this sell, management commented,
“Lastly, in the second quarter, we issued $434 million of common equity through our aftermarket offering program. Our capital management framework provides us the ability to opportunistically create incremental value for existing stockholders through book value and earnings accretion. In the second quarter, we issued stock at a substantial price-to-book premium and invested those proceeds in attractively priced assets.”
This bothers us deeply, to be honest, and is something we continue to monitor. Is the company selling stock in reality to pay the dividend?
Dividend
We continue with the always essential discussion on the dividend. A statement similar to this seems to appear in every call. When asked by Douglas Harter of UBS, Peter Federico, CEO, answered,
“From a total cost of capital, for example, when you take the cost of our common dividend, for example, in the second quarter, the cost of our preferred dividend and our operating costs annualized those, as I did and divide it by our total capital position, you’ll get a number something around 16.3% or, call it, 16.5%. So that’s the amount of return that we need to earn to cover all of those costs in our business. If you compare that to what are the economics of our business at current valuation levels. . .. I think our dividend and our total cost of capital are reasonably well aligned with the economics of where mortgage-backed securities are leveraged and hedged the way we had them and leverage them today.”
Management made it clear that the dividend isn’t at risk anytime soon.
The Chart
Next, we include a chart from TradeStation Securities of AGNC.
TradeStation Securities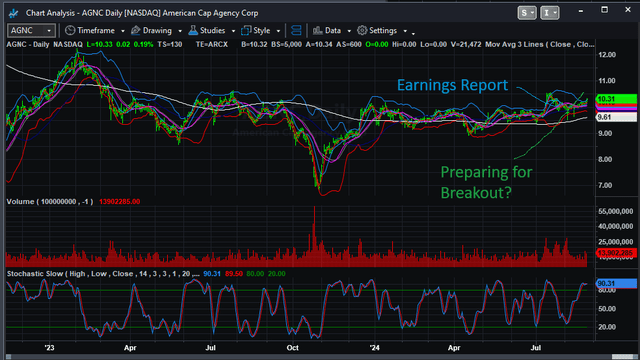
The quarter announcement, labeled in the chart shows, how benign the price action was on the following day. This is a divergence from the past. It is about the future. The FRED chart shown above illustrates a change to a more positive earnings power is becoming. Also, with lower rates, the company can start to purchase more interest-bearing securities from both cash on hand $5 billion plus and through lowering the leverage. The market senses this and is reacting positively.
Risk
The first risk seems to be always about the economy. Is a recession coming, or is it here? JPMorgan Chase CEO Jamie Dimon said he still believes that the odds of a “soft landing” for the U.S. economy are around 35% to 40%, making recession the most likely scenario in his mind. Another risk, rebalancing short-term entities, is also a cash drain. On this subject, Federico added,
“Now what is important to point out, what that doesn’t include when I do that calculation, it doesn’t include the cost of ongoing rebalancing, which would be a drag. So that’s something you have to consider over time. But at the same time, what it also does not include is the positive benefit we get, which is about 2%, for example, on our preferred stock position. So, it’s not the most complete measure, but it’s certainly a good indication.”
On the company’s policy of continuing to sell stock, a practice we are not in favor of, we could sell our lion’s share after rate cuts begin in the $12 region. But until then, we continue our buy rating, with the model generating returns to support the dividend. We, also, understand that the dividend will be paid regardless, a practice that supports the price. The market strongly senses positive changes going forward and acts accordingly.


